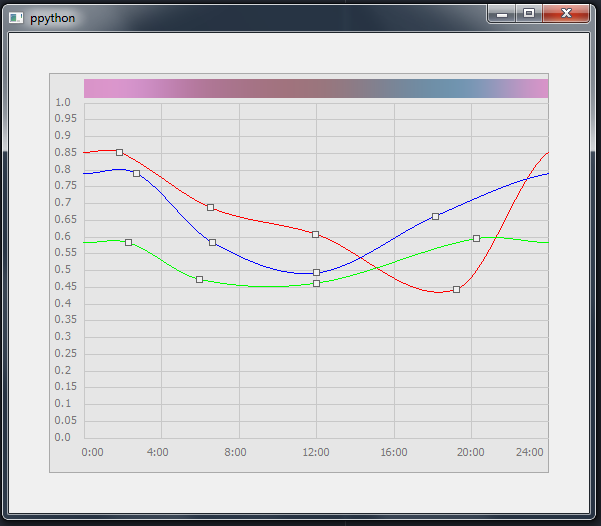
For my pipeline I needed a small widget to edit curves (single values and color values). This editor uses the CurveFitter class, which is pretty cool, but almost used nowhere, so see this as an example for the CurveFitter class as well.
On my todo list:
- Adding new points
- Removing selected point
You will need PyQT 4 to run it.
Screenshot:
Example Usage:
main.py:
import PyQt4.QtCore as QtCore
import PyQt4.QtGui as QtGui

from CurveWidget import CurveWidget

class Editor(QtGui.QMainWindow):

    def __init__(self):
        QtGui.QMainWindow.__init__(self)
        self.resize(580, 480)
        widget = CurveWidget(self)
        widget.setGeometry(40, 40, 500, 400)

# Start application
app = QtGui.QApplication(sys.argv)
editor = Editor()
editor.show()
app.exec_()
CurveWidget.py:
from __future__ import print_function

import math
import sys
from random import random

import PyQt4.QtCore as QtCore
import PyQt4.QtGui as QtGui

from panda3d.core import NurbsCurve, Vec3, Notify, HermiteCurve, CurveFitter


class Curve:

    """ Interface to the NURBS curve which also manages connecting the end of the
    curve with the beginning """

    def __init__(self):
        self._curve = None

        # Append some points to the border, to make sure the curve matches at
        # the edges
        self._border_points = 1

        # Curve color, used for displaying the curve
        self._color = (0, 0, 0)

        # Control points, those are some demo values
        self._cv_points = [
            [0.1, 0.5 + 0.1 * random()],
            [0.15, 0.2 + 0.1 * random()],
            [0.5, 0.4 + 0.1 * random()],
            [0.75, 0 + 0.1 * random()],
            # [1.0, 1]
        ]

        # Build the curve
        self.build_curve()

    def get_cv_points(self):
        """ Returns a list of all controll points """
        return self._cv_points

    def set_color(self, r, g, b):
        """ Sets the display color of the curve """
        self._color = (r, g, b)

    def get_color(self):
        """ Returns the display color of the curve """
        return self._color

    def _get_cv_tangent(self, index):
        """ Returns the tangent of the nth point """
        pb = self._cv_points[(index-1) % len(self._cv_points)]
        pm = self._cv_points[index]
        pa = self._cv_points[(index+1) % len(self._cv_points)]

        get_diff = lambda p1, p2: Vec3( p1[0]-p2[0], p1[1]-p2[1], 0)

        tangent_left = get_diff(pm, pb)
        tangent_right = get_diff(pa, pm)

        tangent_avg = (tangent_left + tangent_right) * 0.5
        return tangent_avg

    def build_curve(self):
        """ Rebuilds the curve based on the controll point values """

        sorted_points = sorted(self._cv_points, key=lambda v: v[0])
        first_point = sorted_points[0]

        fitter = CurveFitter()

        # Duplicate curve at the beginning
        for i in range(self._border_points):
            end_point = self._cv_points[ (-i + self._border_points - 1) % len(self._cv_points) ]
            end_point = first_point
            fitter.add_xyz(0.0, Vec3(0, end_point[1], 0))

        # Append the actual points
        for point in self._cv_points:
            # Clamp point x position to avoid artifacts at the beginning
            point_t = max(0.01, point[0])
            fitter.add_xyz(point_t, Vec3(point_t, point[1], 0))

        # Duplicate curve at the end
        for i in range(self._border_points):
            start_point = self._cv_points[i % len(self._cv_points)]
            start_point = first_point
            fitter.add_xyz(1.0, Vec3(1, start_point[1], 0))

        fitter.sort_points()
        fitter.compute_tangents(1.0)
        self._curve = fitter.make_hermite()

    def set_cv_value(self, index, x_value, y_value):
        """ Updates the cv point at the given index """
        self._cv_points[index] = [x_value, y_value]

    def get_curve_scale(self):
        """ Returns the scale of the curve """
        return self._curve.get_max_t()

    def get_value(self, offset):
        """ Returns the value on the curve ranging whereas the offset should be
        from 0 to 1 (0 denotes the start of the curve). The returned value will
        be a value from 0 to 1 as well. """
        point = Vec3(0)
        self._curve.evaluate_xyz(offset, point)
        return point.y

class CurveWidget(QtGui.QWidget):

    """ This is a resizeable Widget which shows an editable curve which can
    be modified. """

    def __init__(self, parent):
        """ Constructs the CurveWidget, we start with an initial curve """
        QtGui.QWidget.__init__(self, parent)
        self.curves = []

        # Append initial curve
        curve = Curve()
        curve.set_color(255, 0, 0)
        self.curves.append(curve)

        curve = Curve()
        curve.set_color(0, 255, 0)
        self.curves.append(curve)

        curve = Curve()
        curve.set_color(0, 0, 255)
        self.curves.append(curve)


        # Widget render constants
        self._cv_point_size = 3
        self._legend_border = 35
        self._bar_h = 30

        # Currently dragged control point, format is:
        # (CurveIndex, PointIndex, Drag-Offset (x,y))
        self._drag_point = None

        # Currently selected control point, format is:
        # (CurveIndex, PointIndex)
        self._selected_point = None

    def paintEvent(self, e):
        """ Internal QT paint event, draws the entire widget """
        qp = QtGui.QPainter()
        qp.begin(self)
        self._draw(qp)
        qp.end()

    def mousePressEvent(self, QMouseEvent):
        """ Internal mouse-press handler """
        self._drag_point = None
        self._selected_point = None
        mouse_pos = QMouseEvent.pos()
        mouse_x = mouse_pos.x() - self._legend_border
        mouse_y = mouse_pos.y()

        for index, curve in enumerate(self.curves):
            for cv_index, (x, y) in enumerate(curve.get_cv_points()):
                point_x = self._get_x_value_for(x)
                point_y = self._get_y_value_for(y)
                if abs(point_x - mouse_x) < self._cv_point_size + 4:
                    if (abs(point_y - mouse_y)) < self._cv_point_size + 4:
                        drag_x_offset = point_x - mouse_x
                        drag_y_offset = point_y - mouse_y
                        self._drag_point = (index, cv_index, (drag_x_offset, drag_y_offset))
                        self._selected_point = (index, cv_index)

        self.update()

    def mouseReleaseEvent(self, QMouseEvent):
        """ Internal mouse-release handler """
        self._drag_point = None

    def mouseMoveEvent(self, QMouseEvent):
        """ Internal mouse-move handler """
        # print("mouse moved:", QMouseEvent.pos())
        if self._drag_point is not None:
            mouse_x = QMouseEvent.pos().x() - self._drag_point[2][0] - self._legend_border
            mouse_y = QMouseEvent.pos().y() - self._drag_point[2][1] - self._bar_h

            # Convert to local coordinate
            local_x = max(0, min(1, mouse_x / float(self.width() - self._legend_border)))
            local_y = 1 - max(0, min(1, mouse_y / float(self.height() - self._legend_border - self._bar_h)))

            # Set new point data
            self.curves[self._drag_point[0]].set_cv_value(self._drag_point[1], local_x, local_y)

            # Redraw curve
            self.curves[self._drag_point[0]].build_curve()
            self.update()

    def _get_y_value_for(self, local_value):
        """ Converts a value from 0 to 1 to a value from 0 .. canvas height """
        local_value = max(0, min(1.0, 1.0 - local_value))
        local_value *= self.height() - self._legend_border - self._bar_h
        local_value += self._bar_h
        return local_value

    def _get_x_value_for(self, local_value):
        """ Converts a value from 0 to 1 to a value from 0 .. canvas width """
        local_value = max(0, min(1.0, local_value))
        local_value *= self.width() - self._legend_border
        return local_value

    def _draw(self, painter):
        """ Internal method to draw the widget """

        canvas_width = self.width() - self._legend_border
        canvas_height = self.height() - self._legend_border - self._bar_h

        # Draw field background
        painter.setPen(QtGui.QColor(170, 170, 170))
        painter.setBrush(QtGui.QColor(230, 230, 230))
        painter.drawRect(0, 0, self.width() - 1, self.height() - 1)

        # Draw legend

        # Compute amount of horizontal / vertical lines
        # line_spacing = 20

        num_vert_lines = 6 # 24 / 6 = 4, one entry per 4 hours
        line_spacing_x = (self.width() - self._legend_border) / 6.0
        line_spacing_y = (self.height() - self._legend_border - self._bar_h) / 20.0
        num_horiz_lines = int(math.ceil(canvas_height / float(line_spacing_y)) + 1)

        # Draw vertical lines
        painter.setPen(QtGui.QColor(200, 200, 200))
        for i in range(num_vert_lines):
            line_pos = i*line_spacing_x + self._legend_border
            painter.drawLine(line_pos, self._bar_h, line_pos, canvas_height + self._bar_h)

        # Draw horizontal lines
        painter.setPen(QtGui.QColor(200, 200, 200))
        for i in range(num_horiz_lines):
            line_pos = canvas_height - i*line_spacing_y + self._bar_h
            painter.drawLine(self._legend_border, line_pos, self.width(), line_pos)

        # Draw vetical legend labels
        painter.setPen(QtGui.QColor(120, 120, 120))
        for i in range(num_horiz_lines):
            line_pos = canvas_height - i*line_spacing_y + self._bar_h
            painter.drawText(6, line_pos + 3, str(round(float(i) / (num_horiz_lines-1), 2)))

        # Draw horizontal legend labels
        for i in range(num_vert_lines + 1):
            line_pos = i*line_spacing_x + self._legend_border
            offpos_x = -14
            if i == 0:
                offpos_x = -2
            elif i == num_vert_lines:
                offpos_x = -33
            time_string = str(int(float(i) / num_vert_lines * 24)) + ":00"
            painter.drawText(line_pos + offpos_x, canvas_height + self._bar_h + 18, time_string)


        # Draw curve

        for index, curve in enumerate(self.curves):
            painter.setPen(QtGui.QColor(*curve.get_color()))
            last_value = 0
            for i in range(canvas_width):
                rel_offset = i / (canvas_width - 1.0)
                curve_height = self._get_y_value_for(curve.get_value(rel_offset))

                if i == 0:
                    last_value = curve_height

                painter.drawLine(self._legend_border + i-1, last_value, self._legend_border + i, curve_height)
                last_value = curve_height

            # Draw the CV points of the curve
            painter.setBrush(QtGui.QColor(240, 240, 240))

            for cv_index, (x, y) in enumerate(curve.get_cv_points()):
                offs_x = x * canvas_width + self._legend_border
                offs_y = (1-y) * canvas_height + self._bar_h

                if self._selected_point and self._selected_point[0] == index and self._selected_point[1] == cv_index:
                    painter.setPen(QtGui.QColor(255, 0, 0))
                else:
                    painter.setPen(QtGui.QColor(100, 100, 100))
                painter.drawRect(offs_x - self._cv_point_size, offs_y - self._cv_point_size,
                    2*self._cv_point_size, 2*self._cv_point_size)

        # Draw bar
        if len(self.curves) == 1:
            bar_curve = self.curves[0]
        else:
            bar_curve = self.curves[0:3]

        for i in range(canvas_width - 1):
            xpos = self._legend_border + i
            relv = float(i) / float(canvas_width)

            if len(bar_curve) == 1:
                val = max(0, min(255, int(bar_curve.get_value(relv) * 255.0)))
                painter.setPen(QtGui.QColor(val, val, val))
                painter.drawLine(xpos, 6, xpos, self._bar_h - 6)
            else:
                r = max(0, min(255, int(bar_curve[0].get_value(relv) * 255.0)))
                g = max(0, min(255, int(bar_curve[1].get_value(relv) * 255.0)))
                b = max(0, min(255, int(bar_curve[2].get_value(relv) * 255.0)))
                painter.setPen(QtGui.QColor(r, g, b))
            painter.drawLine(xpos, 6, xpos, self._bar_h - 6)