While a lot of focus is placed on shiny new features such as the new shader pipeline, WebGL and Android support, other important aspects of the engine are not being neglected. Because games and other realtime rendering applications are operating under tight performance budgets, high-quality profiling tools are essential to any modern 3D engine. To that end, a significant overhaul of PStats, our performance analysis tool, has been carried out. While PStats has long been essential for understanding and optimizing Panda3D applications, its interface and capabilities had remained largely unchanged for years. The upcoming 1.11 release changes that, introducing a significantly overhauled PStats interface and workflow.
In this post, I will touch on some of the improvements that have been made.
Improved Workflows
Capture Sessions
One of the most significant changes is the introduction of capture sessions. Before, the performance graphs were ony viewable during execution of the program being profiled, and directly thereafter. Now, PStats records the entire session to a file that can be saved to disk and reopened to see all the recorded data. When starting PStats, you can even just click “Load Last Session” to continue analyzing the profiling data from the previous session. Notably, you can also share these session files with others, which is invaluable for collaborative performance analysis. For instance, a tester can record a session file if their machine exhibits a particular performance problem, and share it with a software engineer who is more familiar with the codebase and can take their time analyzing the profiling data on their own machine.
Flame Graph
Understanding what your application is doing at any given moment can be like trying to piece together a puzzle in real-time. The strip chart view offers a kind of hierarchy you can navigate through, but it is not aware of the context in which particular calls are made. The new Flame Graph view provides this information in a much more intuitive way, giving you an immediate overview of how your frame time is spent at a particular frame—from high-level systems down to individual calls.
The Flame Graph visualizes your call tree by representing each function as a block, with the width of each block proportional to the time spent in that function. Functions that call other functions stack on top of each other, creating ‘flames’ that grow taller with deeper call stacks. This makes it immediately obvious which code paths are consuming the most time—the wider the flame, the more time spent in that branch of execution.
By default, only PStats collectors are recorded. For the most detailed analysis, enable the Python profiler integration—this adds complete Python call tracebacks to the flame graph, showing exactly how much time is spent in each function call. This fine-grained information makes it much easier to pinpoint performance bottlenecks in your Python codebase.
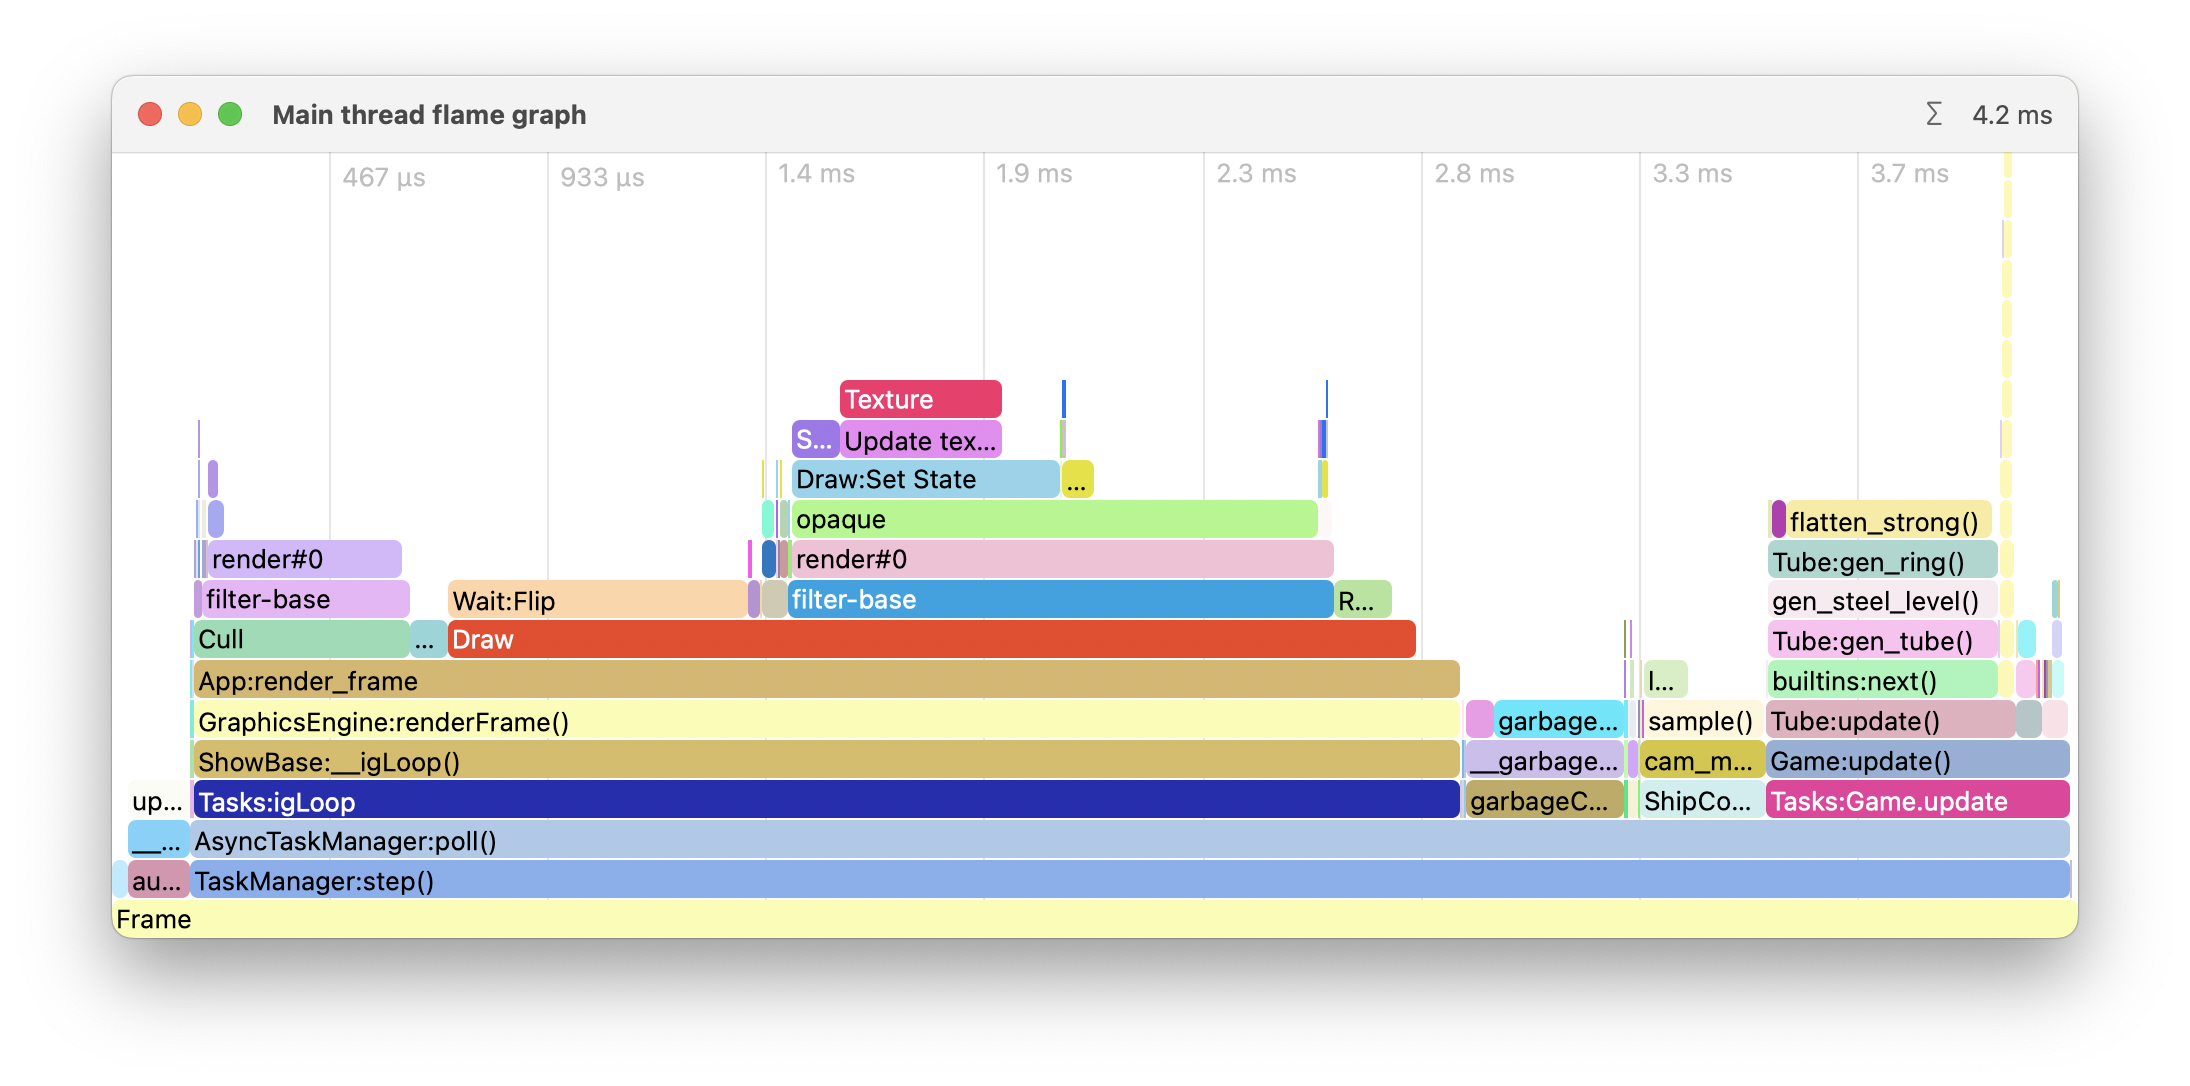
The Flame Graph can show a live running average, or you can scroll through the different frames to see how the time is spent in a particular frame. Double-clicking a particular bar allows you to zoom in and expand a particular sub-tree of the call stack for more in-depth analysis.
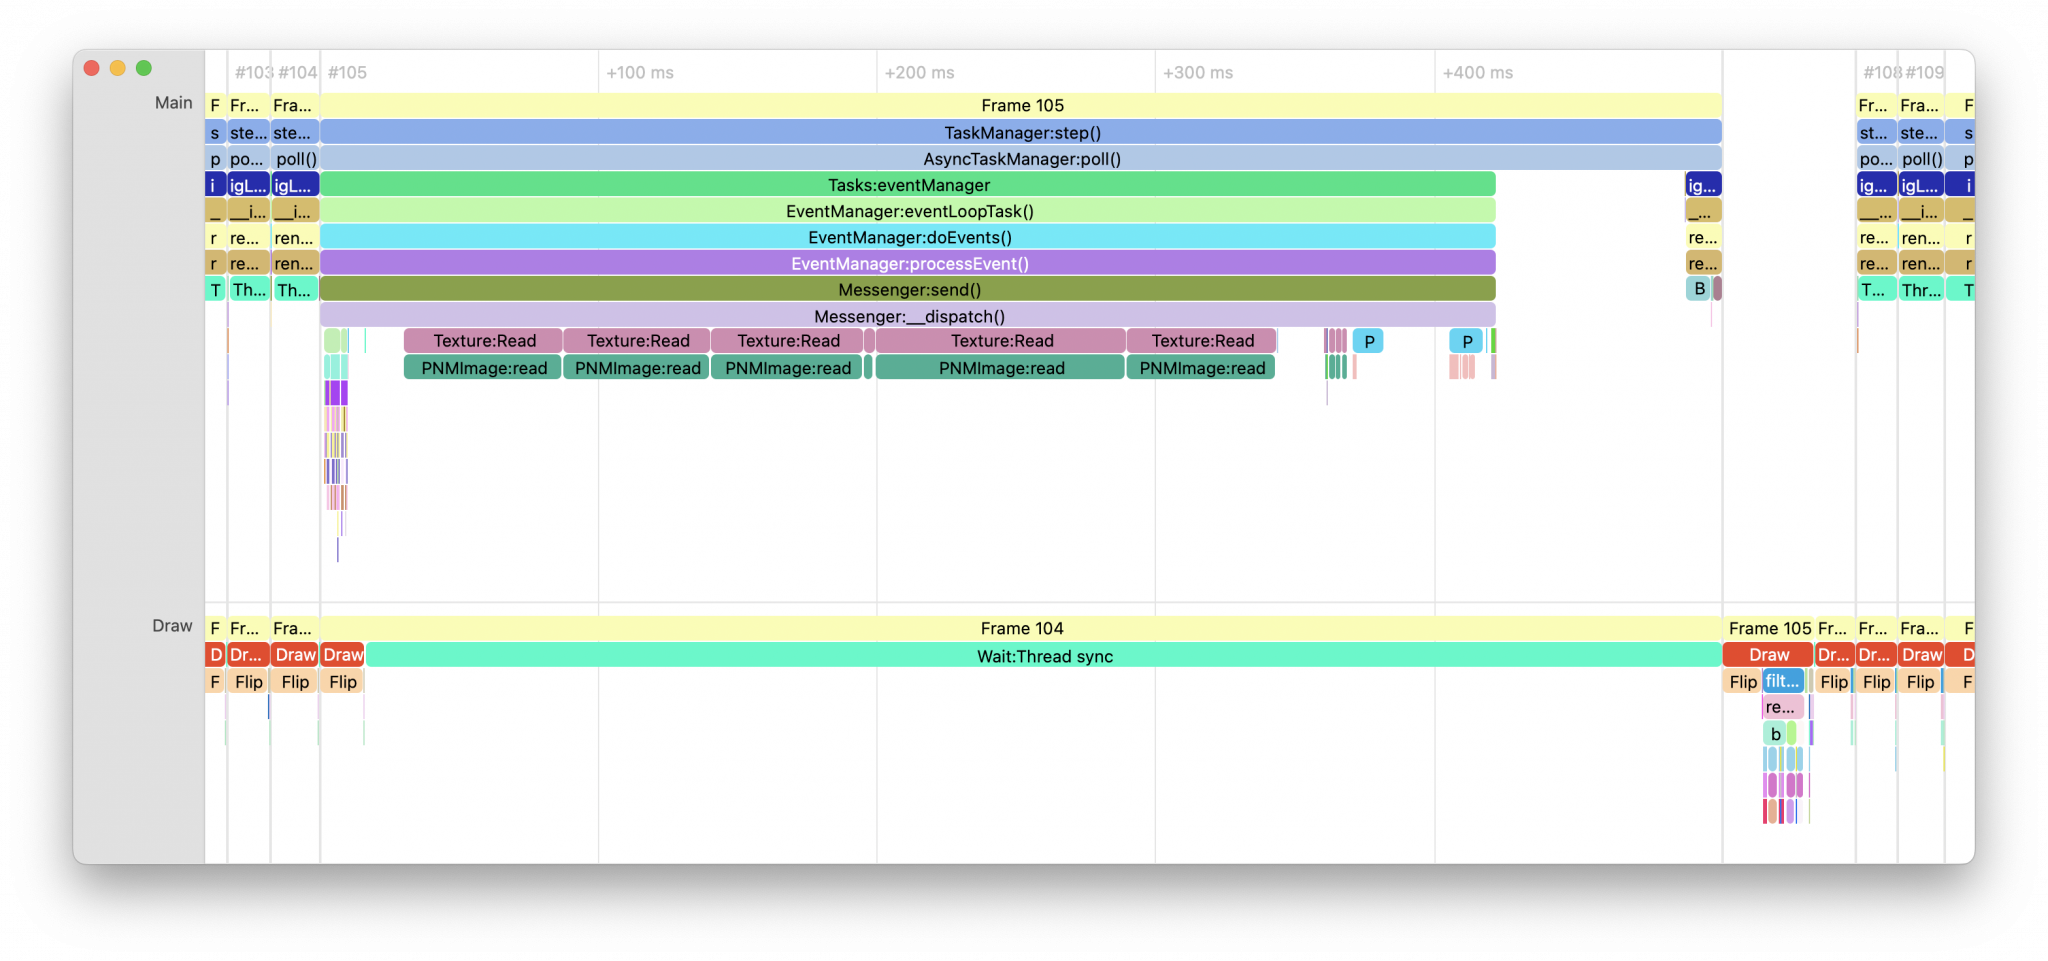
Timeline
The new Timeline view contains a total view over your entire application’s run time, with every collector displayed as a bar on a horizontal timeline. An intuitive navigation interface lets you zoom to a particular frame and see exactly what happened at which point in time. While the other profiling views excel at identifying recurring bottlenecks, the Timeline shines when tracking down those elusive, one-off performance hiccups and lag spikes that might otherwise go unexplained. Like the Flame Graph view, it also shows the nesting structure of collectors.
Where this view also really shines is when profiling multi-threaded applications. It’s the only view that lets you see multiple threads at the same time, making it much easier to spot synchronization issues and understand how your threads interact with each other. For instance, you can quickly identify when one thread is waiting for another to complete a task, or spot unexpected blocking operations that could be causing frame stutters.
Window Layout
Anyone who’s spent some time with PStats knows how tedious it can be to repeatedly set up the preferred arrangement of graph views. With 1.11, PStats not only remembers your workspace layout as part of your session file, but also lets you set a default layout that is used for any new sessions. This includes which windows are open, their placement and size on screen, and even the colors of the various PStats collectors (which can now be overridden from the user interface).
Modern UI Experience
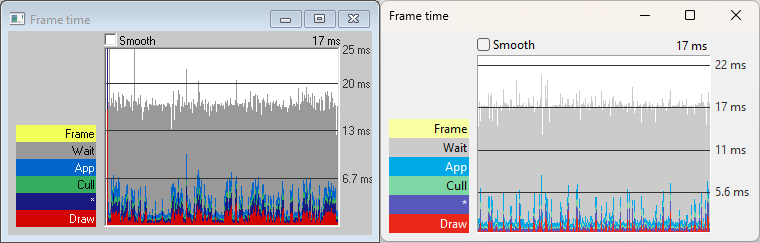
You might have noticed that the screenshots shown above were taken on macOS. Yes, PStats finally has a fully native macOS port! Previously, it was quite a pain to build the GTK+ port and all its dependencies on macOS, and the user experience left much to be desired. The new port also brings proper support for retina displays and dark mode, and generally offers a more user-friendly and native-feeling experience for macOS users, on par with other professional development tools.
It will be shipped with the public builds of Panda3D 1.11, but if you can’t wait for that, you can download a standalone version of PStats for macOS at this link. Don’t worry, it is backward compatible with programs running older versions of Panda3D (at least 1.10.13).
On other platforms, PStats has also received significant modernization. The Linux version has been updated from GTK+2 to GTK+3, bringing proper high DPI support and modern theming capabilities. Windows users will notice a more contemporary look that better matches modern applications, along with improved scaling on high-resolution displays.
General Improvements
Under the hood, PStats has seen numerous technical improvements. Both the server and the client have been optimized for better performance, especially when handling large amounts of profiling data. A JSON export feature has been added for integration with external analysis tools, and quality-of-life features like context menus and customizable colors have been implemented. These improvements, along with many other refinements, make PStats more capable and pleasant to use than ever.
These improvements to PStats are about making sure you have the right tools when you need them. Performance issues are a normal part of game development—having good tools to understand what’s going on is essential. I believe the new PStats hits that mark, and I hope you’ll find it useful in your projects.